

Liquidity and market cycles
Liquidity and market cycles
Market cycles and financial market liquidity

Recently, I've been diving deeper into the topic of financial market cycles and liquidity and I've come across some fascinating insights which reminded me of some very well known literature. In this article, I'll be discussing how we can measure liquidity in the US and how it can help us understand the current trading dynamics. I also want to encourage those, that are interested in this topic to (re)read some classic financial literature.
First, let's start with an old classic: André Kostolany. In his book "The Art of Thinking Clearly About Money" (Die Kunst über Geld nachzudenken), Kostolany emphasizes the importance of understanding the psychology of market participants and the role it plays in market cycles. He believes that market participants tend to behave in predictable ways during different stages of the market cycle, and that understanding these patterns can help investors make more informed decisions. Kostolany also discusses the role of liquidity in financial market cycles. He notes that liquidity is one of the most important factors affecting the stock market, and that investors should pay close attention to changes in liquidity when making investment decisions. It is noted that liquidity is often cyclical, with periods of high liquidity followed by periods of low liquidity, and vice versa. In contrast to others, Kostolany also highlights the importance of trading volume in understanding market movements. He believes that high trading volume is often a sign of strong market trends, and that investors should pay attention to changes in trading volume as a key indicator of market shifts.

I also found that the legendary book "The Alchemy of Finance" by George Soros is another notable classic in the field of financial market cycles. In his studies Soros outlines his theory of reflexivity, which suggests that market participants' beliefs about market conditions can actually impact market conditions themselves. In other words, the way people perceive the market can influence the market's behavior. Soros also emphasizes the importance of understanding the interconnectivity of financial markets and therefore liquidity conditions. He argues that global financial markets as well as policies are all interconnected and that changes in one market can have ripple effects throughout the rest of the world.
Moving on to a more recent published book, Michael J. Howell's "Capital Wars: The Rise of Global Liquidity" Howell is also a very active guest on several podcasts these days and tweets a lot under the handle @crossbordercap. His work provides an in-depth analysis of the global liquidity cycle and its impact on financial markets. It's very interesting because liquidity is often discussed only in the US context and Howell takes a more global view. He argues that central banks play a crucial role in the global liquidity cycle, and that changes in central bank policy can have significant effects on asset prices. Howell also emphasizes the importance of understanding the different types of liquidity in the market, such as market liquidity and funding liquidity. Market liquidity refers to the ease with which assets can be bought or sold without affecting the asset's price, while funding liquidity refers to the availability of financing in the market.
So, after a short excursion into some financial literature let us find out how liquidity is measured, at least for the US.
The Federal Reserve plays a crucial role in adding or removing liquidity in financial markets. Generally, it uses a number of different metrics to operate in financial markets (some might say manipulate them), including the federal funds rate, the discount rate, and the reserve requirement. For us, the FED`s balance sheet is of importance to understand the state of liquidity. In addition, we look at deposits with Federal Reserve Banks as well as Overnight Reverse Repurchase Agreements. Furthermore, I have to admit that it is not just the FED, also the TGA (Treasury General Account) plays an important role in measuring liquidity in the US. The TGA is essentially a bank account that holds the US government's cash balances, and changes in the TGA balance can be a sign of changes in liquidity conditions.
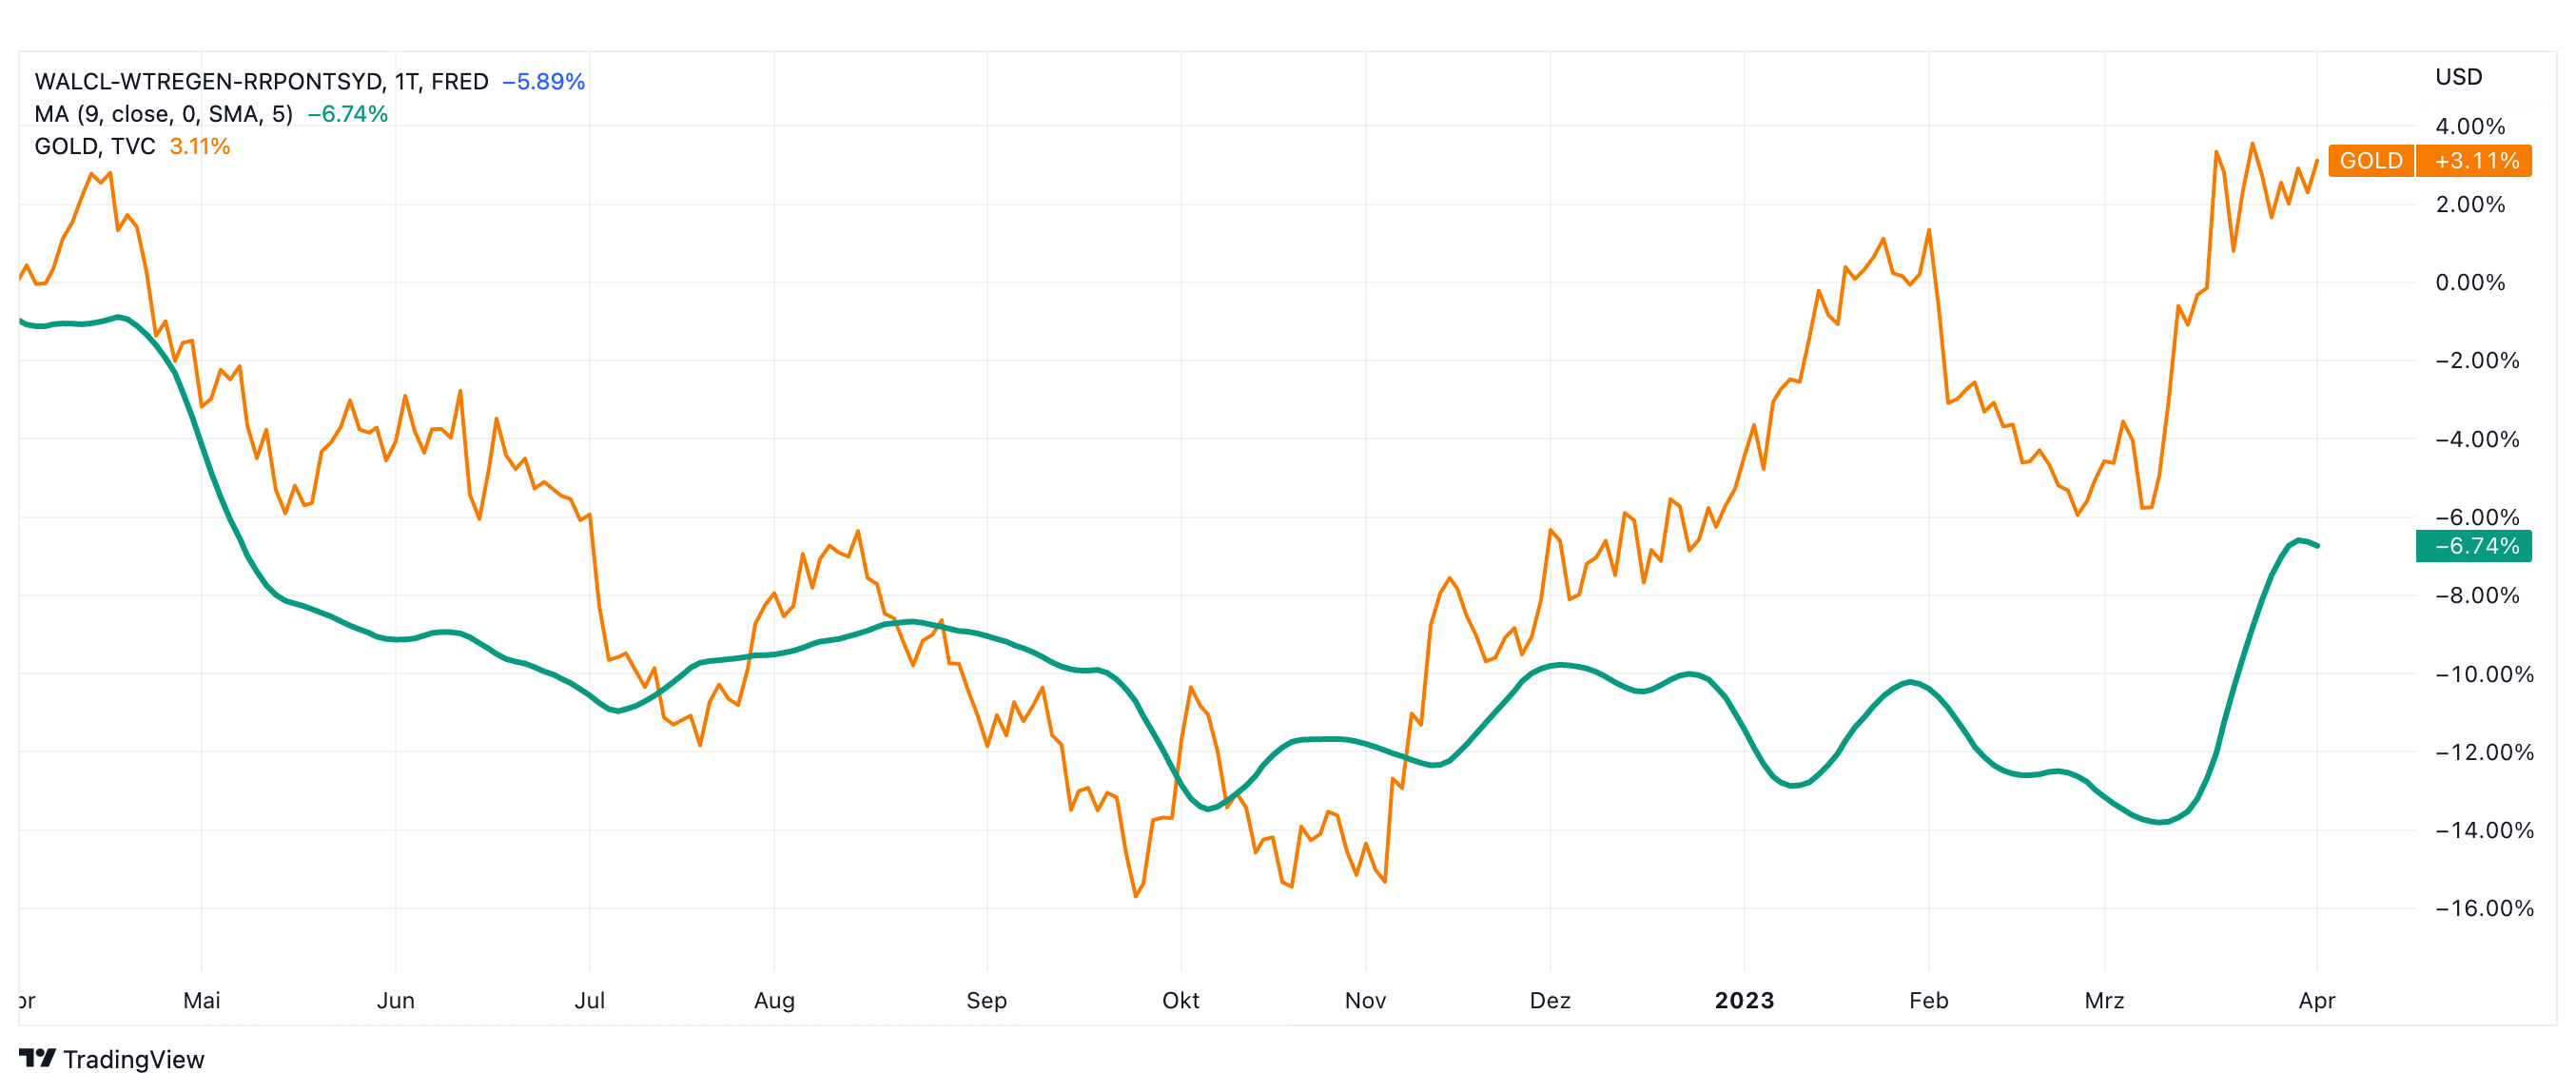
Below I plotted a chart of how the liquidity situation explained above, coincides with the movements of the S&P 500 Index (at least since 2020).


I used the moving average of the liquidity measurement to get a clearer picture. You can track this correlation on your own in TradingView and the metrics for plotting liquidity can be found in the show notes of this interesting conversation. If you try it out on your own, you can find similar correlations with more volatile assets like the NASDAQ or even Bitcoin and Gold.
In conclusion, understanding financial market cycles and liquidity is crucial for investors who want to make informed decisions. By paying attention to the behavior of market players and indicators such as trading volume, liquidity, central bank policy, the TGA balance, we can gain a better understanding of the current market conditions. Of course, there is no free lunch in finance and one perfect indicator does not exist. But at least over the last few years these indicators could have been helpful in anticipating financial markets.
DISCLAIMER: The opinions expressed in this report are based on information which Thomas believes is reliable; however, Thomas does not represent or warrant its accuracy. These opinions represent the views of Thomas as of the date of this report. These opinions may be subject to change without notice and Thomas will not be responsible for any consequences associated with reliance on any statement or opinion contained in this report. This report should not be considered as an offer or solicitation to buy or sell any securities.