

A stock market outside-in approach
A stock market outside-in approach
This article presents a comprehensive framework for everyday investors to gain insights into market regimes and effectively track traders' positioning.


In today's article, I present a framework for approaching financial market activity from an outside-in perspective. Financial markets are influenced by both external macro factors (such as policy, economy, geopolitics, and shocks) and internal factors (including liquidity, positioning, psychology, and animal spirits). However, not all of these factors carry equal weight in their influence. Therefore, it is crucial to develop a comprehensive understanding of the big picture before making any trading decisions. In this article, I will share an outside-in approach that begins with a macro framework and then delves into the micro conditions of the market. I will focus on the S&P 500 Index, which serves as the most liquid stock index and an important benchmark for other mutual funds. While the indicators mentioned may not be suitable for generating alpha due to their coincidental or lagging nature, I believe they can be highly valuable in optimizing one's beta within a long-only portfolio.
To effectively analyze the S&P 500, I am monitoring the following indicators:
Policy Conditions
Economic Conditions
Liquidity Conditions
Market Stability Condition
Market Conditions
Market Positioning
Chart data as of 30.05.2023
To begin our analysis, let's focus on policy conditions, specifically monetary policy. Monetary policy plays a crucial role in determining financial market liquidity. To assess the overall conditions for central bank policymakers, I recommend monitoring the two most basic indicators that fall within the Federal Reserve's mandate: inflation and employment.
To gain an understanding of the required monetary policy stance, I use a straightforward (lagging) indicator that functions as follows: when the indicator turns positive, policymakers are forced consider tightening monetary policy. Conversely, when the indicator shows a negative value, it suggests a need for an accommodative stance on monetary policy. I like this as a starting point because it can give us orientation of where we are in the cycle and it has a quite good historical track record in anticipating recessions. Time will tell, but the odds are high that this time it is not going to be different.
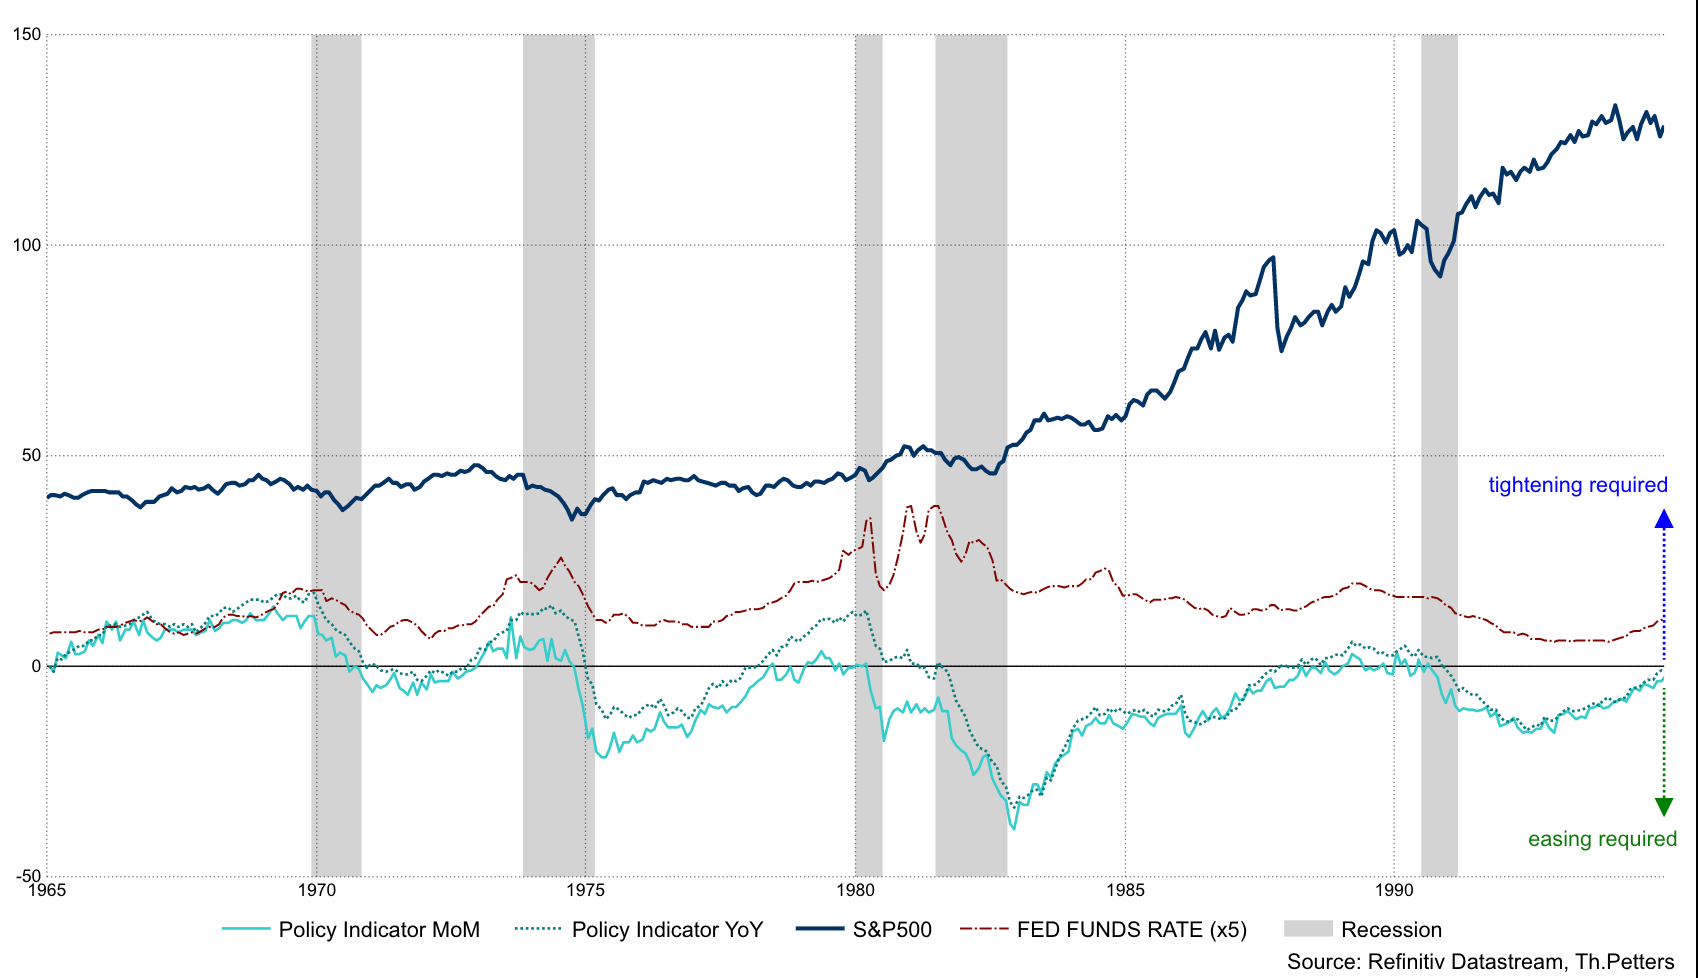
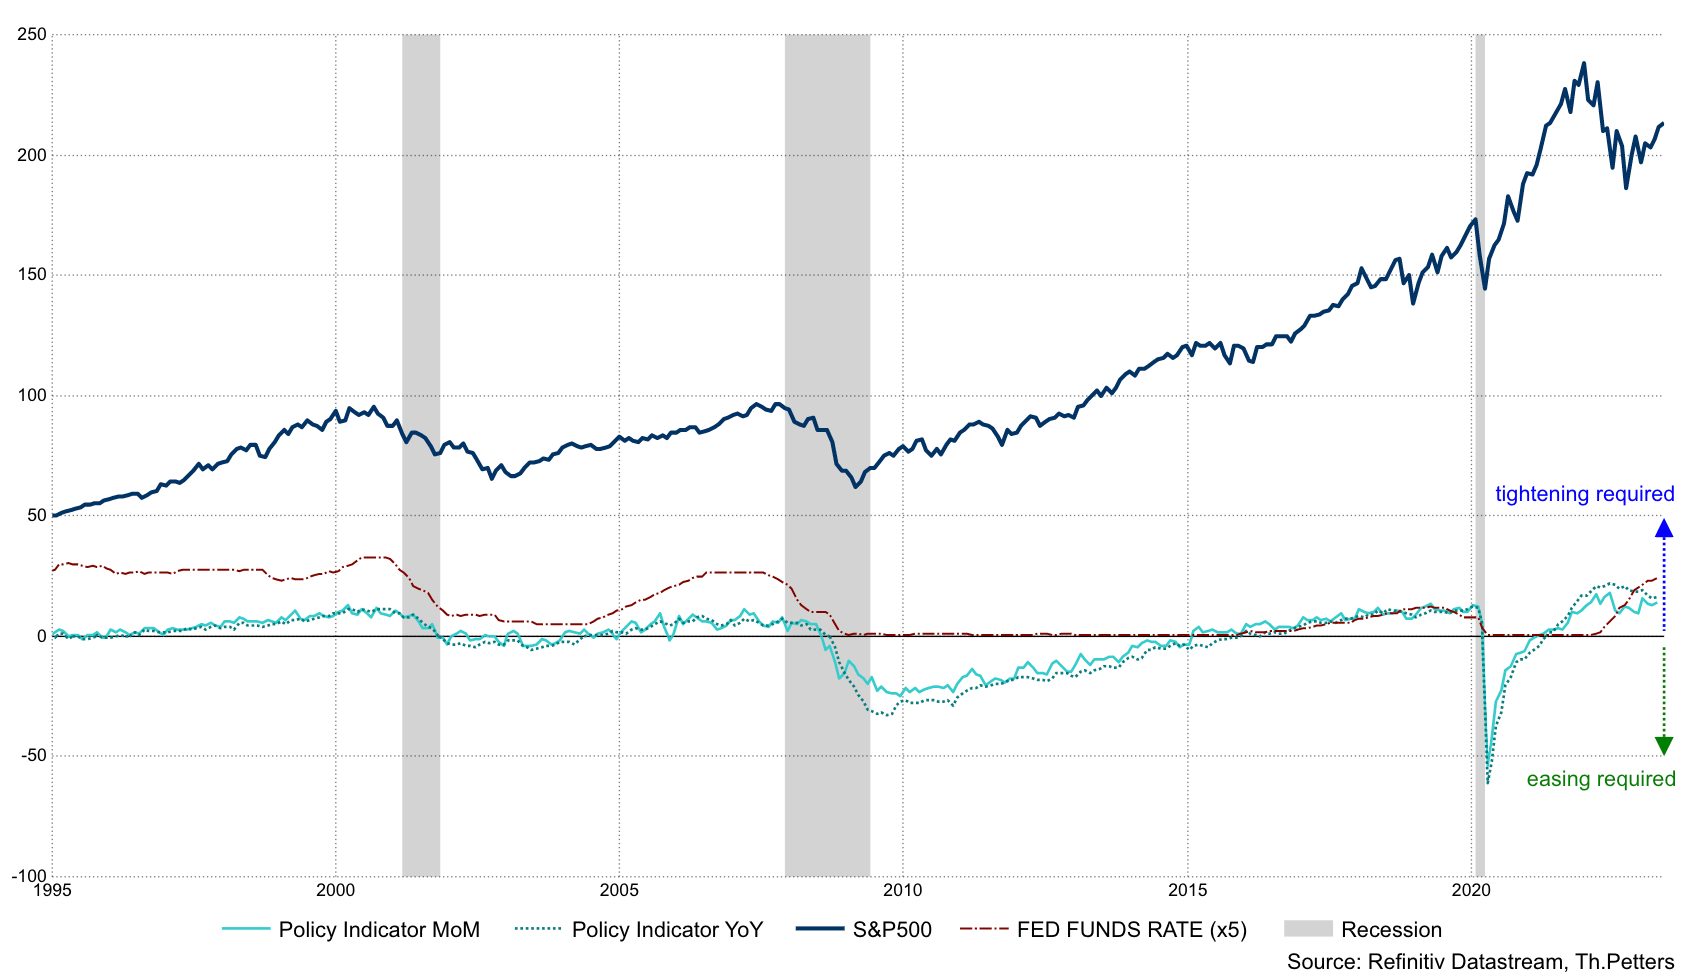
My conclusion from this consideration is that monetary policy is required to be tight at the moment, which is reflected in the ongoing interest rate hikes and the enforcement of QT.
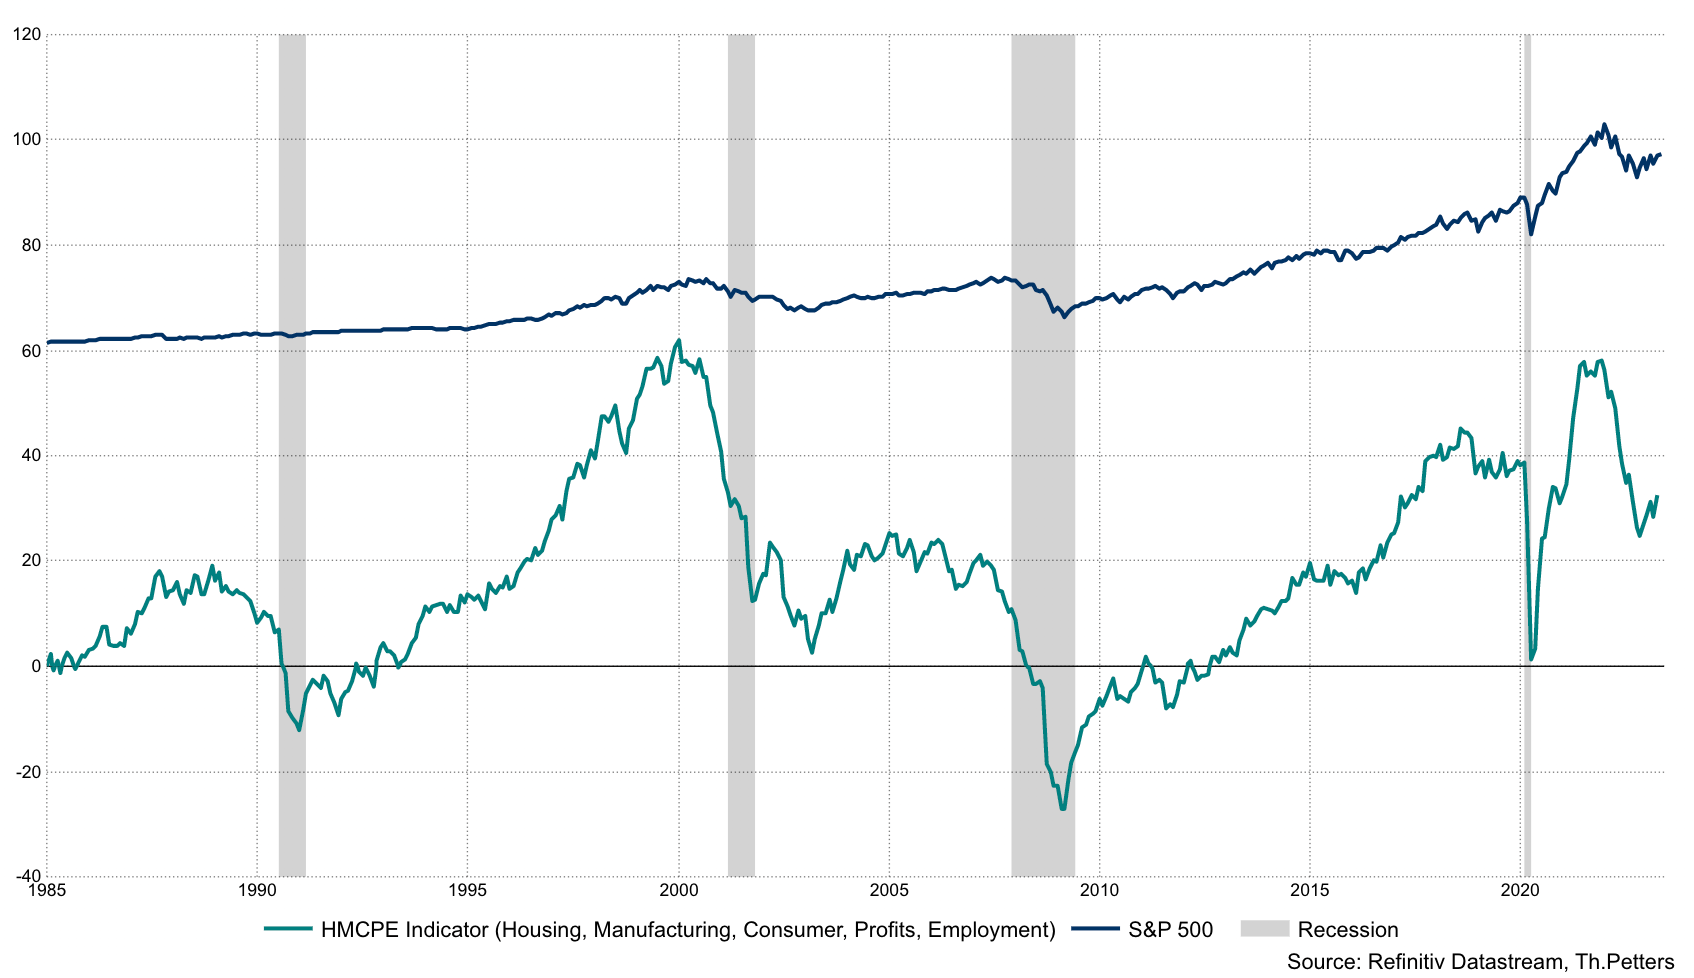
Let us continue with economic conditions. One can debate whether economic conditions directly influence financial markets, anyhow there are a few indicators that in my observations do influence stock market behavior. Here I watch the combined conditions in: housing, manufacturing, consumer expectations, company earnings and employment. Turning points in this indicator have almost coincided with the stock markets highs and lows in in the last three recessions. While this is not a guarantee for future behavior, I believe it can a helpful tool for orientation as long as you believe that the cyclicality in markets is not dead.
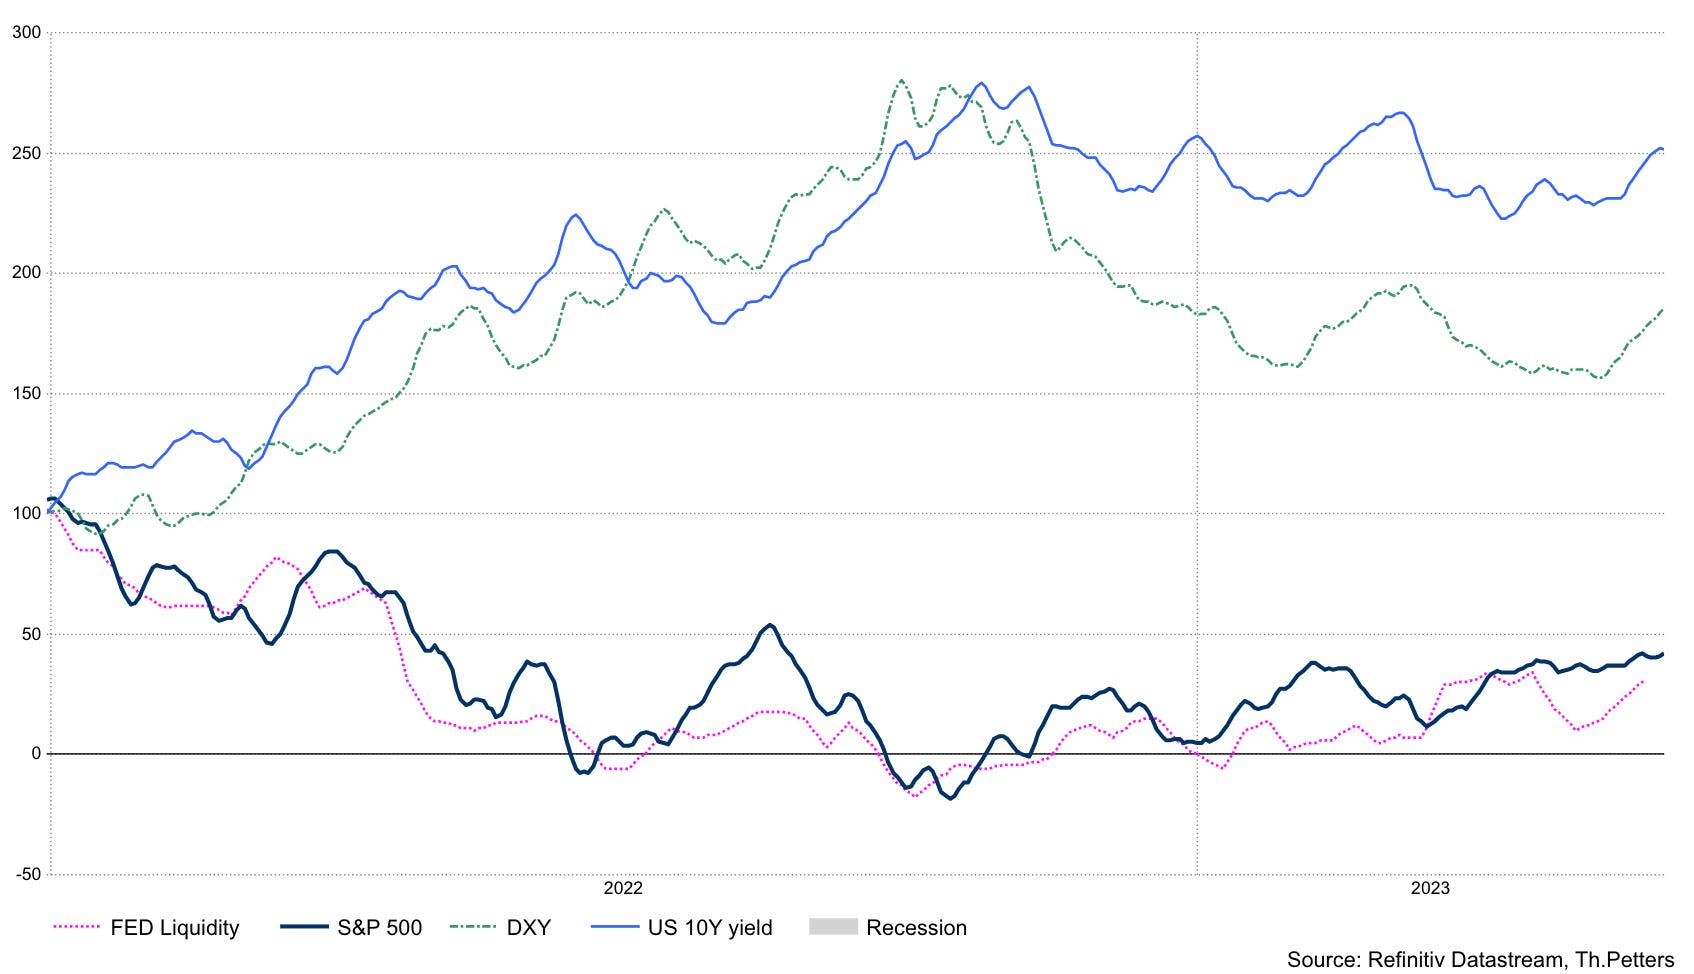
Indeed, monetary policy, specifically central bank liquidity, has been a major driver for risk assets in recent times. Many market participants argue that the actions and policies of central banks have a significant impact on financial market liquidity and subsequently influence the performance of risk assets, including the S&P 500 index.
When examining the correlation between the S&P 500 index and your simple FED liquidity model, you have observed an almost 1:1 correlation since January 2022. This suggests a strong relationship between central bank liquidity and the movements in the stock market.
In addition to central bank liquidity, it is also important to consider the impact of the US Dollar and the US Treasury 10-year note on liquidity conditions for the US stock market. While the correlation may not be as perfect as with central bank liquidity, monitoring these factors can provide valuable orientation and insights into liquidity dynamics.
By analyzing the relationship between central bank liquidity, the US Dollar, and the US Treasury 10-year note, investors can gain a better understanding of the liquidity environment and potentially identify opportunities or risks within the US stock market.
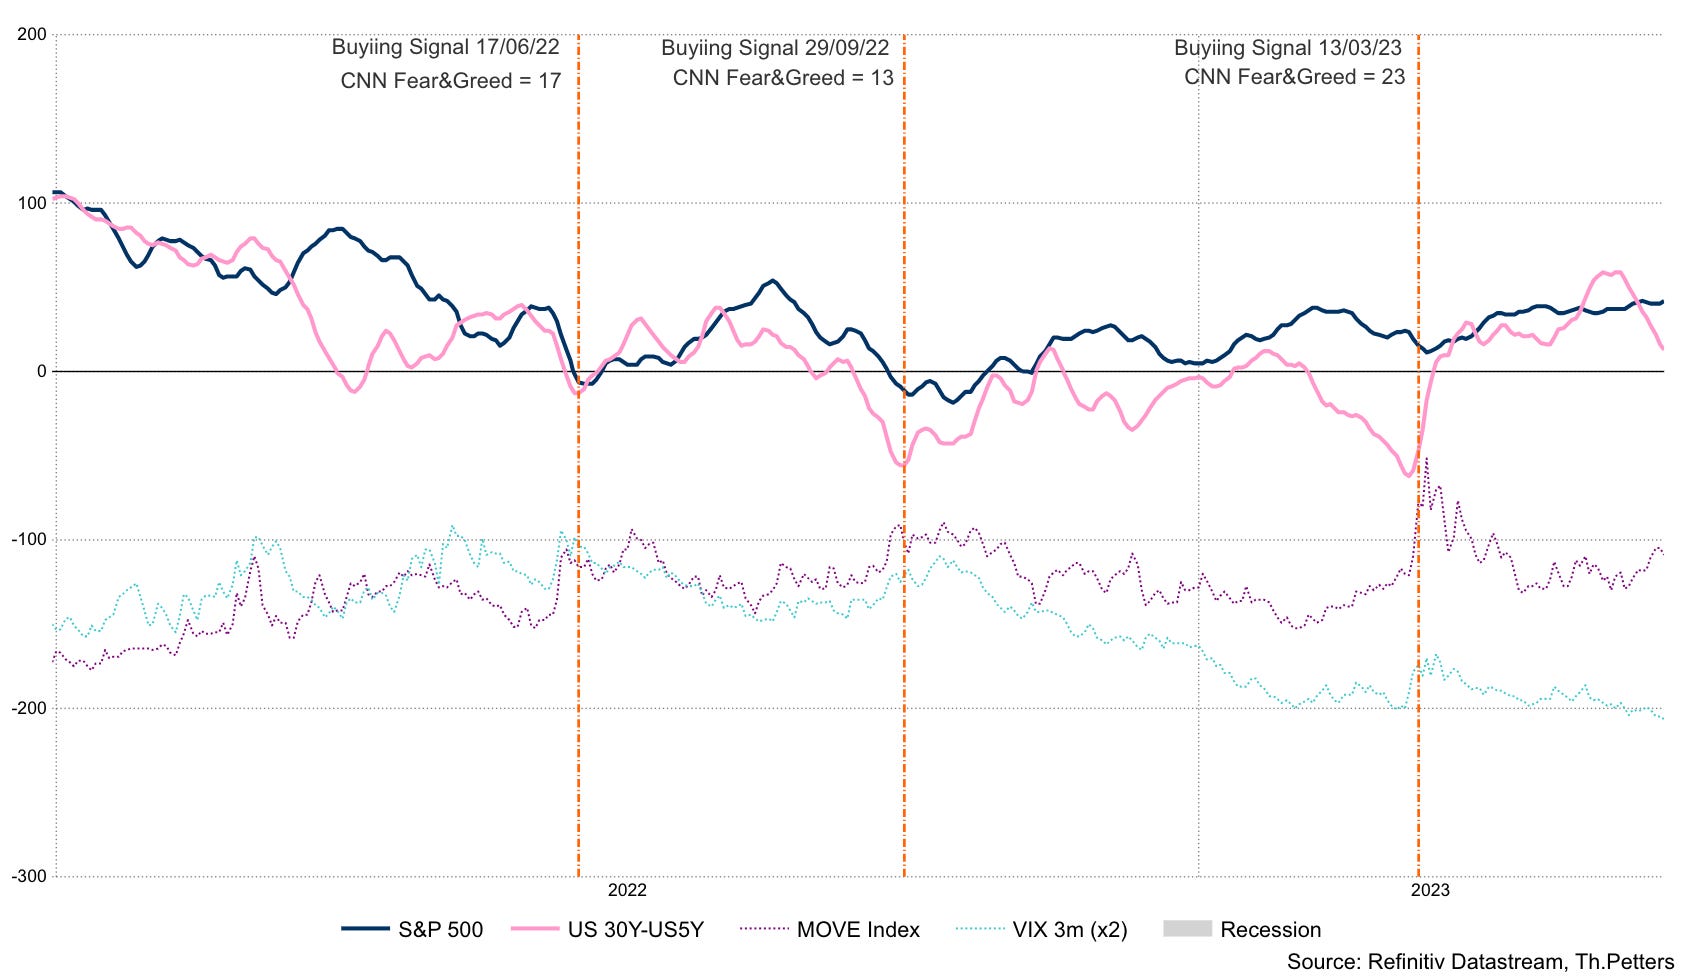
Before delving deeper into the intricacies of the stock market, it's important to gain an understanding of market stability. During times of market instability, policymakers often respond by injecting liquidity into the system. When signs of stress emerge, it is worth monitoring the FED liquidity indicator mentioned earlier to track policy responses.
Another helpful and straightforward indicator to consider is the spread between the US 30-year and US 5-year yields. A significant decrease in this spread, coupled with an increase in the MOVE and VIX indices, indicates stress within the financial system, prompting policymakers to take action.
While our natural instinct may be to feel fearful and exit the market during these times, they often present compelling buying opportunities that can maximize returns. Warren Buffett's famous quote to "be greedy when others are fearful" highlights this principle. To gauge market sentiment during extreme conditions, one can use simple sentiment indicators like the CNN Fear & Greed Index. In the past, interesting buying opportunities have arisen when this index falls below 25 ("Extreme Fear") in conjunction with a signal from the aforementioned indicator. Typically, market prices would have experienced significant declines in the days preceding such a signal.
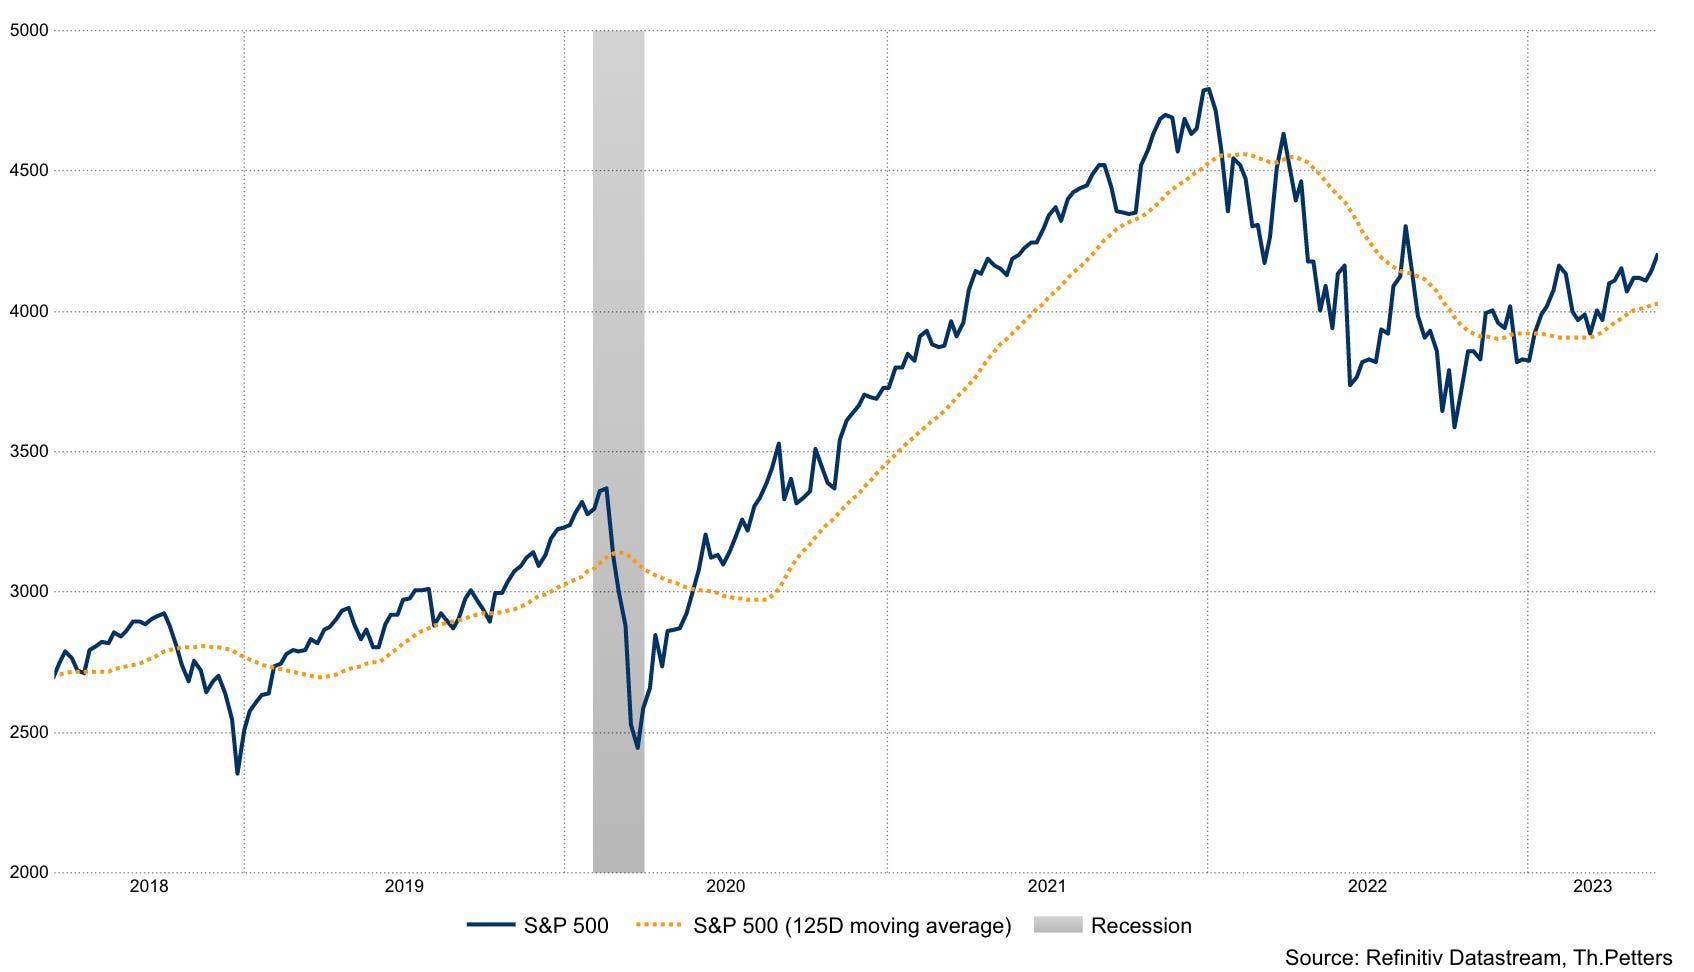
After examining the market from a macro perspective, let's now delve deeper into the dynamics of the S&P 500 Index. While there are numerous methods to analyze the stock market, I will present a few simple ones to assess overall market conditions.
Firstly, it is worth challenging the S&P 500 against its 125-day moving average. This widely used indicator provides insights into market pricing and helps assess the current trend. By comparing the index's performance to its moving average, you can gain a better understanding of whether the market is trading above (more bullish) or below (more bearish) its average level.
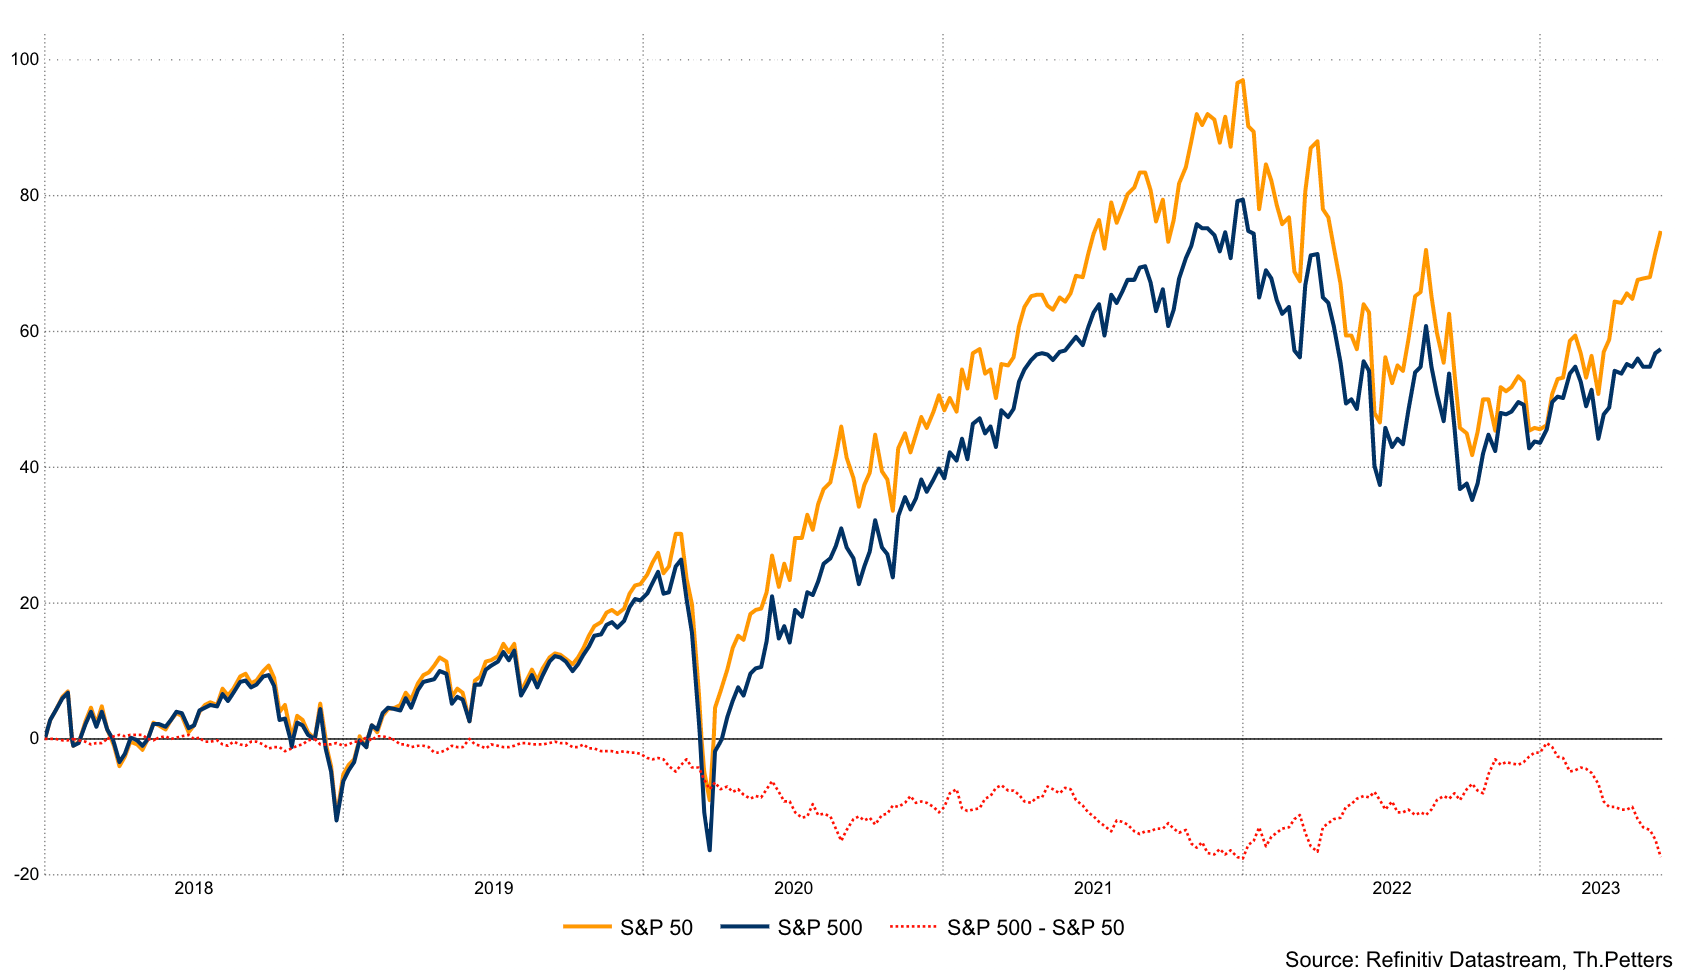
Additionally, examining the difference between the S&P Top 50 and the S&P 500 Index can serve as a straightforward proxy to assess market breadth. This comparison provides an approximation of how the larger companies within the index are performing relative to the overall market.
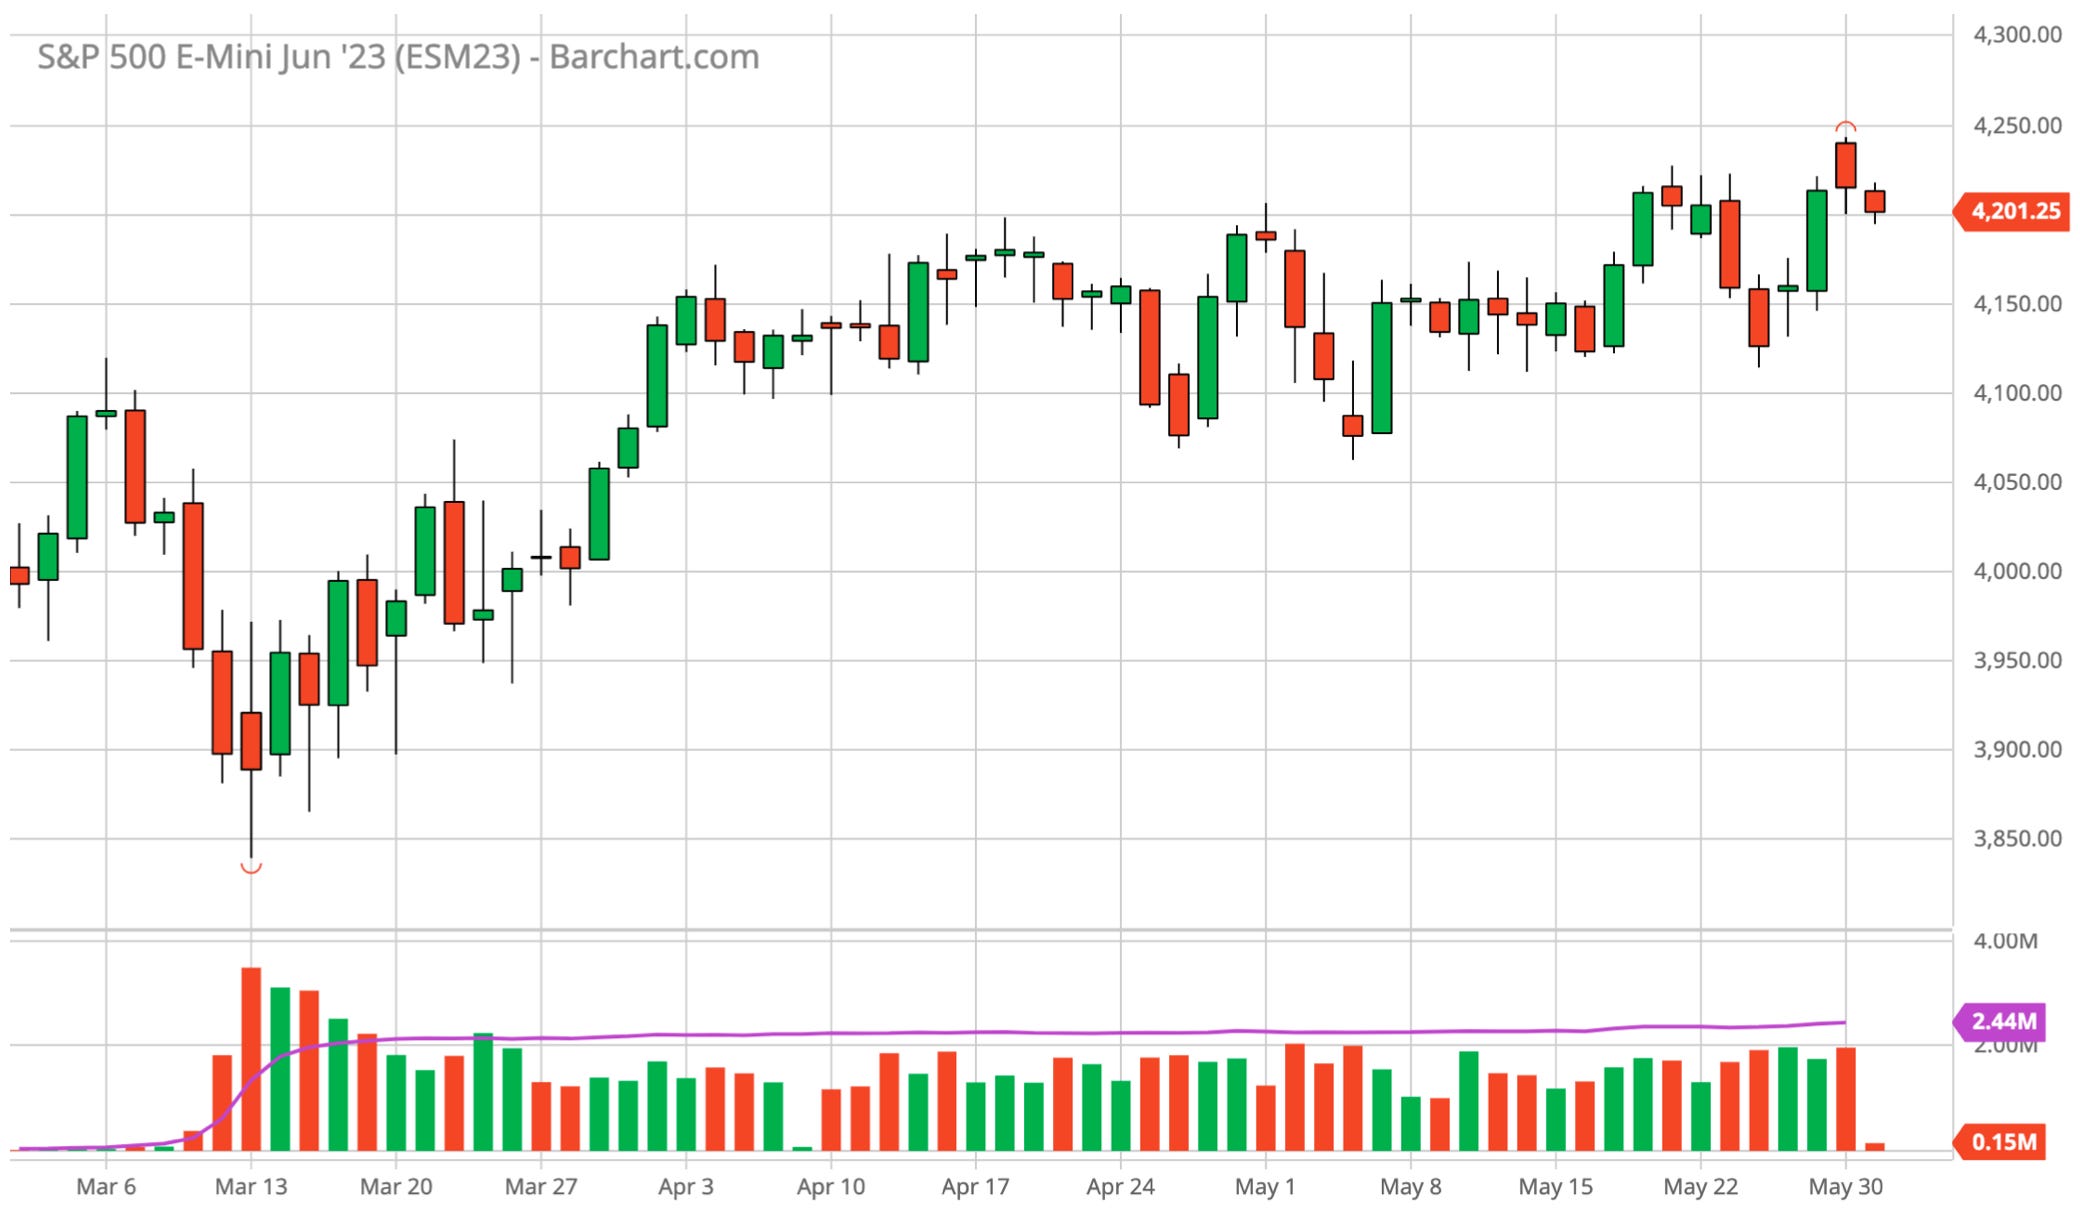
Finally, let's examine the market positioning of traders and fund managers, which requires a closer examination of the market's wires. Understanding the futures positioning of market participants can provide valuable insights, although it should be approached with caution, as it can sometimes be misleading when used as a sole basis for trading decisions. However, it can still be helpful in gaining a good understanding of the actual market conditions.
The first chart looks at volumes, which can help us assess whether the bulls or bears are leading the market. Monitoring trading volumes provides insights into the level of participation and can indicate the strength of a particular trend or direction.
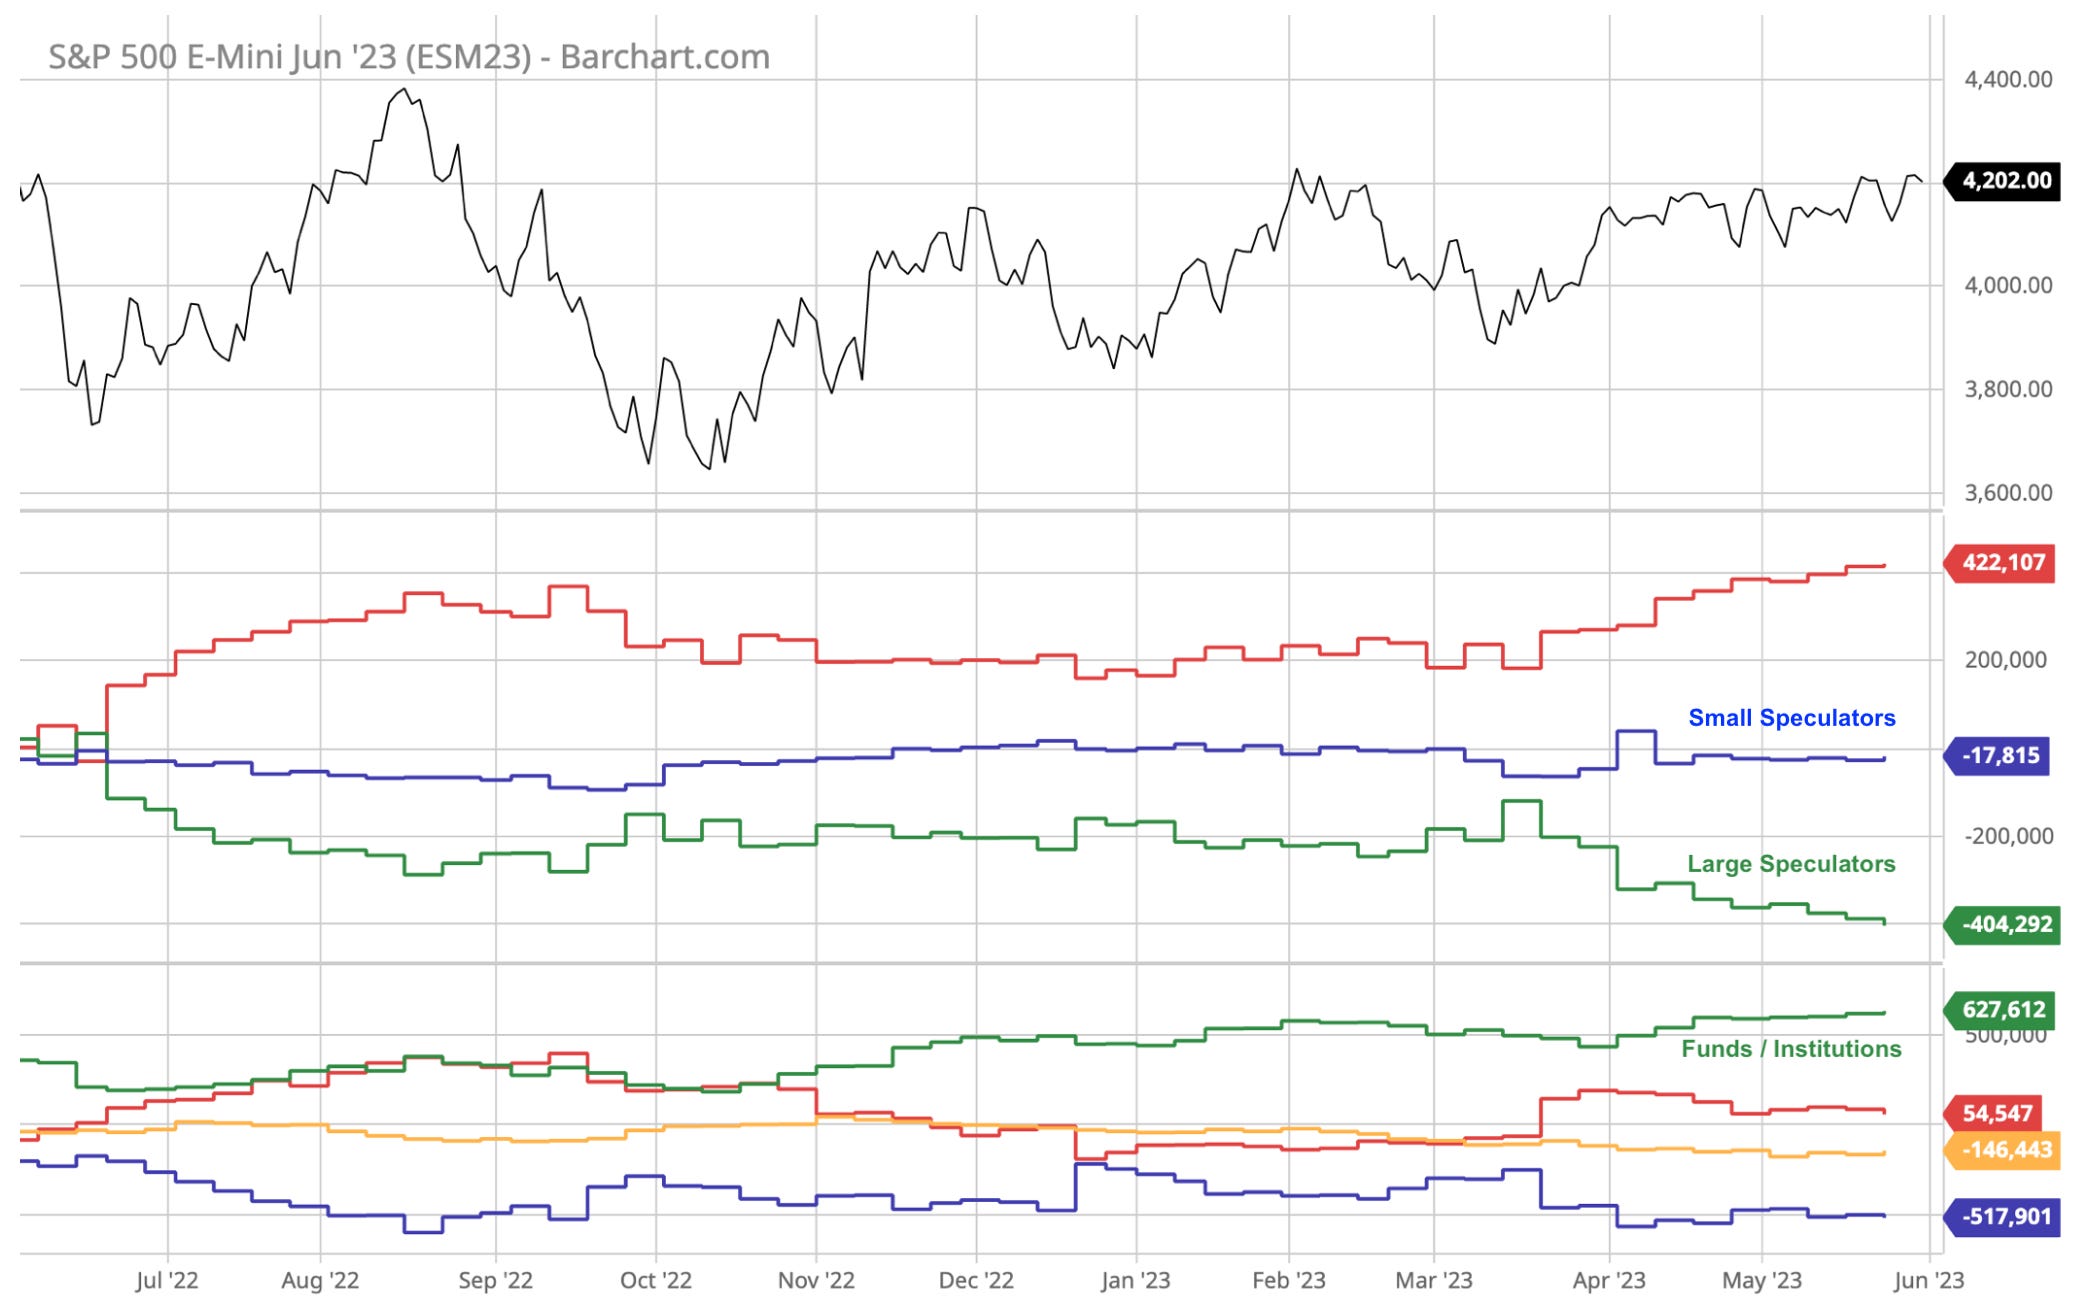
In the second chart, we can analyze the Commitments of Traders (COT), which provides information on the positioning of futures traders, often referred to as speculators. The COT report offers insights into the actions and sentiment of these market participants, giving us a glimpse of their positioning in the market.
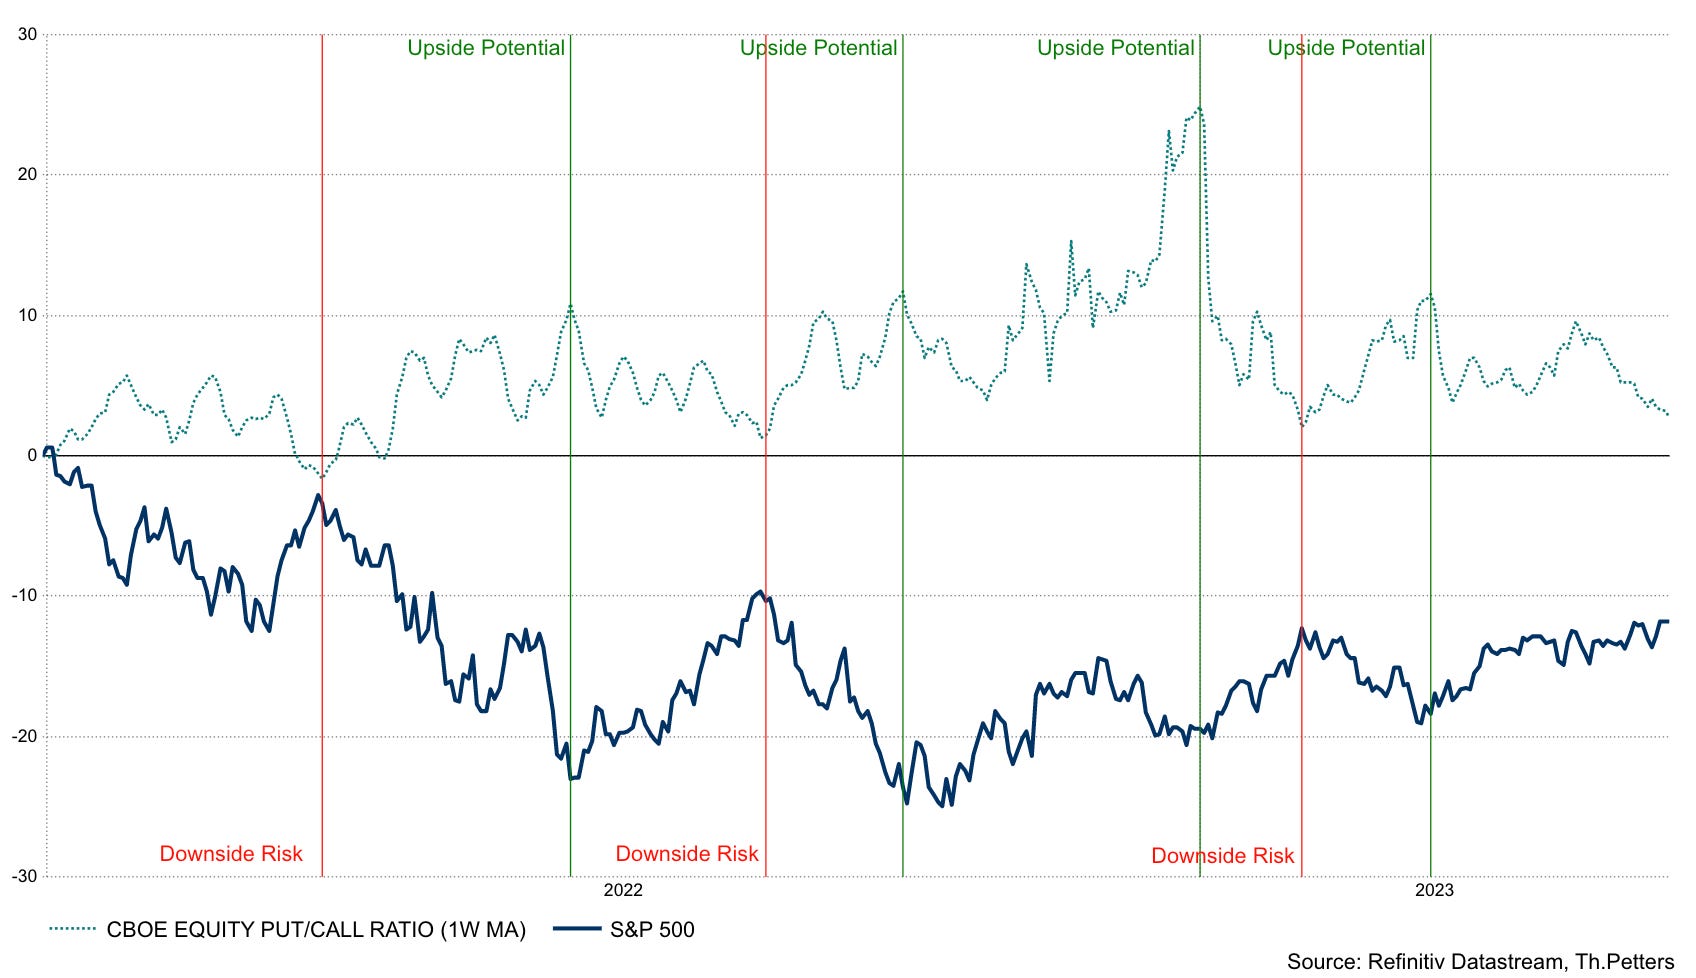
Lastly, it is worth examining the CBOE Put/Call Ratio chart. This ratio compares the volume of put options (bearish bets) to call options (bullish bets) traded on the Chicago Board Options Exchange (CBOE). It can be a useful tool in understanding potential turning points in the market, as extreme readings in the put/call ratio can indicate excessive optimism or pessimism among market participants.
Remember that while these indicators can provide valuable information about market positioning, they should be used in conjunction with other analysis tools to make well-informed trading decisions.
Finally I would like to remind you that this blog post is no investment advise and I do this for sharing my educational outcomes only. Anyhow, I hope you find this content interesting and I am happy to share it.
My personal conclusion from analyzing these indicators in combination with this weeks price action is the following:
Policy Conditions (FED policy is required to remain tight)
Economic Conditions (neutral → reaccelerating)
Liquidity Conditions (neutral → reaccelerating)
Market Stability Condition (neutral to declining → Treasury yield spread falling, Move-index rising & Vix-index still suppressed)
Market Conditions (bullish sentiment in big tech, high spread between S&P 500 vs Top 50 is a sign of underlying weakness)
Market Positioning (neutral to declining → no extrem positioning, BUT low put/call ratio)
Based on the assessment provided, it appears that the market is currently in a relatively unstable equilibrium without a clear trend emerging. Except the hype in AI related stocks (see big tech), there are not too many bullish fundamental. In such situations, it is indeed wise to exercise caution and be mindful of potential downside risks.
If you find value in this approach and would like to discuss any potential areas where you may be mistaken or explore additional ideas, I encourage you to leave a comment. Collaboration and discussion can lead to further insights and enhance the overall analysis.
DISCLAIMER: The opinions expressed in this report are based on information which Thomas believes is reliable; however, Thomas does not represent or warrant its accuracy. These opinions represent the views of Thomas as of the date of this report. These opinions may be subject to change without notice and Thomas will not be responsible for any consequences associated with reliance on any statement or opinion contained in this report. This report should not be considered as an offer or solicitation to buy or sell any securities. This is for educational and entertainment purposes only and should not be considered as investment advice.